Content
- Introduction
- History
- Who was Mendel
- Mendel’s Laws of Heredity
- Mendel’s Experiments
- The Rule of Unit Factors
- Gregor Mendel’s Discoveries
- Reasons for Choosing Pea Plants
- Types of Mendel's Laws
- Mendel’s Conclusions
- References
Introduction
In plant and animal genetics research, the
decisions a scientist will make are based on a high level of confidence in the
predictable inheritance of the genes that control the trait being studied. This
confidence comes from a past discovery by a biologist named Gregor Mendel, who
explained the inheritance of trait variation using the idea of monogenic
traits.
- Living things have genes in their cells
that encode the information to control a single trait. These genes are stable
and passed on from cell to cell without changing.
- The genes are in pairs in somatic cells.
When these cells divide to form gametes, the pair of genes is divided. One
gene from the pair goes into a gamete.
- Male gametes (pollen) combine with female
gametes (eggs) in the wheat flower pistil and fuse to form the next generation
(zygote). Gamete union is random.
- The zygote, again, has two copies of each
gene. As the zygote grows into a multicellular seed and the seed grows into a
plant, the same two gene copies are found in every cell.
He did this over & over & over
again, and noticed patterns to the inheritance of traits, from one set of pea
plants to the next. By carefully analyzing his pea plant numbers, he discovered
three laws of inheritance. After his death
(1884) acknowledgment of his discoveries in 1900,
History
In the mid 1800’s, an Austrian monk named Gregor
Mendel (Figure 1) decided he should try to understand how inherited traits are
controlled. He needed a model organism he could work with in his research
facility, a small garden in the monastery, and a research plan. His plan was
designed to test a hypothesis for the inheritance of trait variation.
Since
Mendel could obtain different varieties of peas that differed in easy to
observe traits such as flower color, seed color and seed shape, and he could
grow these peas in his garden, he chose peas as the model organism for
conducting his inheritance control study. A model is easy to work with and
often what you learn from the model you can apply to other organisms.
Figure 1. Gregor Mendel was born Johann Mendel.
Mendelian concept
of hereditary
The laws of inheritance were derived by Gregor Mendel, a 19th century monk conducting
hybridization experiments in garden peas (Pisum sativum).
Between 1856 and 1863, he
cultivated and tested some 29,000 pea plants. From these experiments he deduced
two generalizations which later became known as Mendel's Laws of Heredity or Mendelian
inheritance. He described these laws in a two part paper,
"Experiments on Plant
Hybridization" that he read to the Natural History Society of Bruno on February 8 and March 8, 1865, and which was published
in 1866.
Mendel's
findings allowed other scientists to predict the expression of traits on the
basis of mathematical probabilities. A large contribution to Mendel's success
can be traced to his decision
to start his crosses only with plants he demonstrated were true-breeding. He
also measured only absolute (binary)
characteristics, such as color, shape, and position of the offspring, rather
than quantitative characteristics. He expressed his results numerically and subjected them to statistical analysis.
His method of data analysis and his large sample size gave credibility to his data. He also had the foresight to follow several successive generate (f2, f3) of his pea plants and
record their variations. Finally, he performed "test crosses" (back- crossing descendants of the initial
hybridization to the initial true-breeding lines) to reveal the presence and proportion of recessive
characters. Without his careful attention to procedure and detail, Mendel's work could not have had the impact
it made on the world
of genetics.
Mendel's Laws
Mendel
discovered that by crossing white flower and purple flower plants, the result
was not a hybrid offspring. Rather
than being a mix of the two, the offspring was purple flowered. He then conceived the idea of heredity units,
which he called "factors", one which is a recessive characteristic and the other dominant.
Mendel said that factors, later called genes, normally occur in pairs in ordinary body cells, yet segregate during the
formation of sex cells. Each member
of the pair becomes part of the separate sex cell. The dominant gene, such as
the purple flower in Mendel's plants,
will hide the recessive gene, the white flower. After Mendel self-fertilized the F1 generation and
obtained the 3:1 ratio, he correctly theorized that genes can be paired in three different ways for
each trait; AA, aa, and Aa. The capital A
represents the dominant factor
and lowercase a represents the recessive. Mendel
stated that each individual has two factors for each trait, one from each
parent. The two factors may or may not contain
the same information. If the two factors are identical, the individual is called homozygous
for the trait. If the two factors have different information, the individual is called heterozygous.
The alternative forms of a factor are called alleles. The genotype of
an individual is made up of the many alleles it possesses. An individual's
physical appearance, or phenotype, is
determined by its alleles as well as
by its environment. An individual
possesses two alleles for each trait; one allele is given by the female parent
and the other by the male parent.
They are passed on when an individual matures and produces gametes: egg and sperm. When gametes form,
the paired alleles separate randomly so that
each gamete receives a copy of one of the two alleles. The presence of
an allele doesn't promise that the
trait will be expressed in the individual that possesses it. In heterozygous individuals the only allele that is
expressed is the dominant. The recessive allele is present but its expression is hidden. Mendel
summarized his findings in two laws; the Law
of Segregation and the Law of Independent Assortment.
Law of Segregation (The "First Law")
The Law of Segregation states that when
any individual produces gametes, the copies of
a gene separate, so that each gamete receives only one copy. A gamete
will receive one allele or the other.
The direct proof of this was later found when the process of meiosis came to be known. In meiosis the paternal and
maternal chromosomes get separated and the alleles with the characters are segregated
into two different gametes.
Law of Independent Assortment (The "Second Law")
The
Law of Independent Assortment, also known as "Inheritance Law", states that alleles of different genes assort independently of one another
during gamete formation. While Mendel's
experiments with mixing one trait always resulted in a 3:1 ratio between
dominant and recessive phenotypes,
his experiments with mixing two traits (dihybrid cross) showed 9:3:3:1 ratios. But the 9:3:3:1 table shows that
each of the two genes are independently inherited with a 3:1 ratio. Mendel concluded that different traits are
inherited independently of each
other, so that there is no relation,
for example, between a cat's color and tail length. This is actually only true for genes that
are not linked to each other.
Independent assortment occurs during meiosis I
in eukaryotic
organisms, specifically metaphase I
of meiosis, to produce a gamete with
a mixture of the organism's maternal and paternal
chromosomes. Along with chromosomal
crossover, this process aids in increasing genetic diversity by producing novel genetic combinations.
In
independent assortment the chromosomes that end up in a newly-formed gamete are randomly
sorted from all possible combinations of maternal and paternal chromosomes. Because gametes end up with a random mix instead of a
pre-defined "set" from either parent, gametes are therefore considered assorted independently. As such, the gamete
can end up with any combination of
paternal or maternal chromosomes. Any of the possible combinations of gametes formed from maternal and
paternal chromosomes will occur with equal frequency. For human gametes, with 23 pairs of
chromosomes, the number of possibilities is 2^23 or 8,388,608 possible combinations. The gametes will normally
end up with 23 chromosomes, but the origin
of any particular one will be randomly selected from paternal or
maternal chromosomes. This contributes to the genetic
variability of progeny.
Rediscovery of Mendelís work
Mendel's conclusions were largely ignored.
Although they were not completely unknown to
biologists of the time, they were not seen as generally applicable, even by
Mendel himself, who thought they only
applied to certain categories of species
or traits. A major block to understanding
their significance was the importance attached by 19th century
biologists to the apparent blending
of inherited traits in the overall appearance of the progeny, now known to be due to multigene interactions, in contrast
to the organ-specific binary characters studied by Mendel. In 1900, however, his work was
"re-discovered" by three European scientists, Hugo de Vries,
Carl Correns,
and Erich von Tschermak.
The exact nature of the "re-discovery" has been somewhat debated: De Vries published first
on the subject, mentioning Mendel in a footnote, while Correns pointed out Mendel's priority after having read De
Vries's paper and realizing that he
himself did not have priority. De Vries may not have acknowledged truthfully
how much of his knowledge of the
laws came from his own work, or came only after reading Mendel's paper. Later scholars have accused Von Tschermak
of not truly understanding the
results at all. Regardless, the
"re-discovery" made Mendelism an important but controversial theory.
Its most vigorous promoter in Europe
was William Bateson,
who coined the term "genetics",
"gene",
and "allele" to describe many of its tenets.
The
model of heredity was highly contested by other biologists because it implied
that heredity was discontinuous, in
opposition to the apparently continuous variation observable for many traits. Many biologists also
dismissed the theory because they were
not sure it would apply to all
species, and there seemed to be very few true Mendelian characters in nature. However, later work by biologists and
statisticians such as R.A. Fisher showed
that if multiple Mendelian factors
were involved in the expression of an individual trait, they could produce the diverse
results observed. Thomas Hunt Morgan and his assistants later integrated the theoretical model of Mendel with the chromosome theory of inheritance, in which the chromosomes of
cells were
thought to hold the actual hereditary material, and create what is now known
as classical genetics, which was extremely
successful and cemented Mendel's place in
history.
Mendel's Laws of Inheritance
Mendel postulated three laws, which are now called after his name as Mendel’s
laws of heredity. These are:
- Law of dominance and recessive
- Law of segregation
- Law of independent assortment
1.Law of Dominance
Definition:
When two homozygous individuals with one or more sets of contrasting characters are crossed, the characters that appear in the F1 hybrids are dominant characters and those do not appear
in F1 are recessive characters.
Law of dominance-
If there are two alleles
coding for the same trait and one is dominant it will show up in the
organism while the other won't
Explanation: The dominance and recessive of genes can be explained on the basis of enzymatic
functions of genes. The dominant
genes - are capable of synthesizing active polypeptides or proteins that form functional enzymes, whereas the recessive genes (mutant
genes) code for incomplete or non-functional polypeptides. Therefore, the
dominant genes produce a specific
phenotype while the recessive genes fail to do so. In the heterozygous condition
also, the dominant
gene is able to express
itself, so that the heterozygous and homozygous individuals have similar phenotype.
Critical appreciation of Law of Dominance
Scientists conducted cross-breeding
experiments to find out the applicability of law of dominance. The experiments
were conducted by Correns on peas and maize, Tschermak on peas, by
De Vries on maize etc., by Bateson and his collaborators on a variety of
organisms, by Davenport on poultry,
by Furst on rabbits, by Toyama on silk moth and by many others. These scientists observed that a large number of characters in various organisms are related
as dominant and recessive.
Importance of law of dominance
The
phenomenon of dominance is of practical importance as the harmful recessive characters are masked by the normal
dominant characters in the hybrids. In Human beings a form of idiocy, diabetes, haemophilia etc. are recessive
characters. A person hybrid for all these characteristics
appears perfectly normal. Thus harmful recessive genes can exist for several generations without expressing themselves.
Exceptions to Law of Dominance is the Incomplete Dominance. After Mendel
several cases were recorded by scientists, where F1 hybrids exhibited
a blending of characters
of two parents.
These hybrids were found to be midway between the two parents. This is known as incomplete
dominance or blending
inheritance. It means that two genes of the allelomorphic pair are not related as dominant and recessive, but each of them expresses
itself partially. As for example, in four-o'clock plant, Mirabilis jalapa, when plants
with red flowers (RR) are
crossed with plants having white
flowers (rr), the hybrid
F1 plants (Rr) bear pink flowers. When these F1 plants with pink flowers are self-pollinated they develop red (RR), pink (Rr) and
white (IT) flowered plants in the ratio of 1
: 2 : 1 (F2 generation).
2. Law of Segregation (Purity
of Gametes)
Explanation -
The law of segregation states that when a pair of contrasting factors or genes or allelomorphs are brought together in
a heterozygote (hybrid) the
two members
of the
allelic pair remain together
without being
contaminated and when gametes
are formed from the hybrid, the two separate
out from each other
and only one enters each gamete.
Example - Pure tall plants are homozygous and, therefore/possess genes (factors) TT; similarly, dwarf possess genes tt. The tallness and dwarfness are two independents but contrasting factors or
determiners. Pure tall plants produce gametes all of which possess gene T and dwarf plants t type of gametes.
During cross
fertilization gametes with T and t unite to produce hybrids of F1 generation. These hybrids possess genotype Tt. It means F1 plants, though tall phenotypically, possess
one gene for tallness
and one gene for dwarfness. Apparently, the tall and dwarf characters appear to
have become contaminated developing only tall character. But at the time of
gamete formation, the genes T (for tallness) and t (for dwarfness) separate and are passed on to separate gametes. As a result, two types of gametes are produced from the
heterozygote in equal numerosity. 50% of the gametes possess gene T and other 50% possess gene t. Therefore, these gametes are either pure for tallness or for dwarfness. (This is why the law of segregation is also described as Law of purity of gametes).
.png)
Gametes
unite at random and when gametes are numerous all possible combinations can occur, with
the result that tall and dwarf appear in the ratio of 3 :1. The results are
often represented by Punnett
square as follows:
Critical appreciation of law of segregation
It has been confirmed by cytological studies that dominance
or no dominance, the law of segregation
holds good to all cases. Its far reaching applicability has made it rare
biological generalization.
- RR have
only gene for round
- Rr, rR have gene for round
and wrinkle
- Rr have only wrinkeld gene
Round, Wrinkled - 3:1 ratio
3. Law of Independent Assortment
Definition: The
inheritance of more than one pair of characters (two pairs or more) is studied simultaneously,
the factors or genes for each pair of characters assort out independently of
the other pairs. Mendel formulated this law from the results
of a dihybrid cross.
Explanation: The
cross was made between plants having yellow and round cotyledons and plants having green and wrinkled
cotyledons.
The
F1 hybrids all had yellow and
round seeds. When these F1 plants were self fertilized they produced four types of plants in the following proportion:
(i) Yellow and round 9
|
(ii) Yellow and
wrinkled
|
3
|
|
(iii) Green and round
|
3
|
|
(iv) Green and wrinkled
|
1
|
The above results
indicate that yellow and green seeds appear in the ratio of 9 + 3 : 3 + 1 = 3 :
1. Similarly, the round and wrinkled
seeds appear in the ratio of 9 + 3 : 3 +1 = 12:4 or 3 :1. This indicates that each of the two pairs of alternative characters viz. yellow-green cotyledon
colour is inherited
independent of the
round-wrinkled character of the cotyledons. It means at the time of gamete
formation the factor for yellow colour
enters the gametes
independent of R or r, i.e, gene Y can be passed
on to the gametes either
with gene R or r.
Cytological
explanation of the results: In the
above experiment yellow and round characters are dominant over green and wrinkled characters which can be represented as follows:
- gene for yellow colour of cotyledons Y
- gene for green colour of cotyledons y
- gene for round character of cotyledons R
- gene for wrinkled character of colyledons r
Therefore, plants with
yellow and round cotyledons will have their genotype YYRR and those with green and wrinkled cotyledons will have a
genotype yyrr. These plants will produce gametes with gene YR and
yr respectively. When these
plants are cross pollinated, the union of these
gametes will produce F1 hybrids with YyRr genes. When these produce gametes all the four genes have full freedom to assort independently
and, therefore, there are possibilities of four combinations in both male and female
gametes.
(i) RY (ii) Ry (iii) rY (iv) ry
This shows an
excellent example of independent assortment. These gametes can unite at random producing in all 16 different
combinations of genes, but presenting
four phenotypes in the ratio of 9: 3: 3: 1.
Dihybrid ratio: RR yy - Round, yellow seeded
; Rr yy - Wrinkled
and greed seeded
Test cross
F1 Rr Yy x rr yy (recessive) 1:1:1:1
Critical appreciation of law of Independent Assortment-
The law of
independent assortment fails to have
a universal applicability. Cytological
studies have revealed that
only those allelomorphs assort independently
during meiosis, which are located
in different homologous pairs of chromosomes. But, if the allelomorphs for different characters are present
in the same homologous
pair of chromosomes, these are passed
on to the same gamete. Law of independent assortment does not apply to such cases.
BIOLOGICAL SIGNIFICANCE OF MENDEL'S LAWS
Mendel's work remained burried for about three decades, but after its rediscovery, the laws are being used for the various branches of breeding. These are use for improving the varieties of fowls and their eggs; in obtaining rust-resistant and disease-resistant varieties of grains. Various new breeds of horses and dogs are obtained by cross breeding experiments. The science of Eugenics
is
the outcome of Mendelism, which
deals with the betterment of human race.
Mendelian deviation
Mendelian
deviations or exceptions or anomalies includes
- Incomplete dominance
- Codominance
- Lethal genes
etc.
1. Incomplete dominance
Mendel always observed complete dominance
of one allele over the other for all the seven
characters, which he studied, in garden pea. Later on cases of
incomplete dominance were reported.
For example, in four ëoí clock plant (Mirabilis jalapa) there are two types of
flower viz., red and white. A cross
between red and white flowered plants produced plants with intermediate flower
colour i.e. pink colour in F1 and a modified
ratio of 1 red: 2 pink: 1 White in F2.
Parents Red flower x White
flower RR
x rr
F1 Rr pink flower
F2 1 Red (Rr) : 2 Pink
(RR) : 1 White (rr)
Fig.-Incomplete dominance in flowers
of Mirabilis jalapa
2. Codominance
In case of codominance both alleles express
their phenotypes in heterozygote greater
than an intermediate one. The example
is AB blood group in human. The people who have blood type AB are heterozygous
exhibiting phenotypes for both the IA and IB alleles. In other words, heterozygotes for codominant
alleles are phenotypically similar to both parental types. The main difference between codominance
and incomplete dominance lies in the
way in which genes act. In case of codominance both alleles are active while in case of incomplete dominance both
alleles blend to make an intermediate one.
Codominance - both genes fully expressed
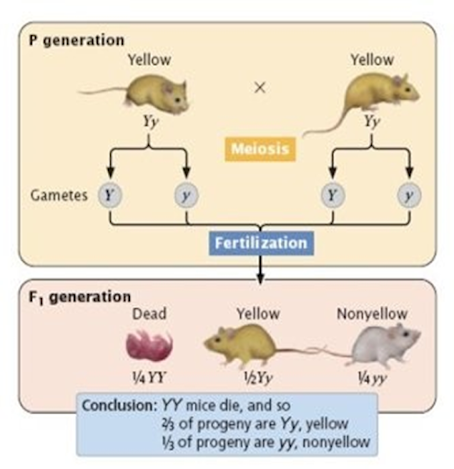
3. Lethal
genes
Gene,
which causes the death of its carrier when in homozygous condition is called
lethal gene. Mendel’s findings were
based on equal survival of all genotypes. In normal segregation ratio of 3:1 is modified into 2:1 ratio.
Lethal genes have been reported in both animals as well as plants. In mice allele for yellow coat
colour is dominant over grey. When a cross is made between yellow and grey a ratio of 1:1 for yellow and gray mice
was observed. This indicated that yellow mice are always heterozygous. Because yellow homozygotes are never born because of homozygous
lethality. Such genes were not observed by Mendel. He
always got 3:1 ratio in F2 for
single gene characters.
Lethal genes can be recessive, as in the
aforementioned mouse experiments. Lethal genes
can also be dominant, conditional, semilethal, or synthetic, depending on the
gene or genes involved.
MONOHYBRID CROSS
A cross is made between two true-breeding parents differing for a single trait, producing
an F1 generation. These plants
are intercrossed to produce an F2 generation.
Dihybrid Crosses
The following
legends were described for peas by Mendel:
T- Tall
tt - dwarf
G
- green (pod) gg- yellow
Pure
breeding parents can be crossed to produce a
dihybrid meaning that 2 genes affecting different traits are heterozygous (segregating) in all the f1 progeny.

 Examples: TT, GG X tt, gg → Tt, Gg
TT, gg X
tt, GG → Tt, Gg
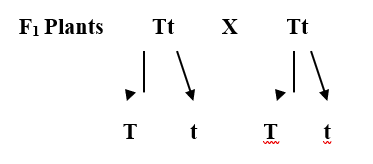
When the F1 is self-fertilized (plants) or
crossed with another Tt, Gg individual, the progeny will show the expected 3 dominant : 1 recessive
phenotypic ratio for each trait. If the two traits
are independent, the two 3 : 1 ratios will interact to give a ratio based
on 16ths.
|
#
|
Genotypes
|
Phenotypes
|
|
9
|
T_, G_
|
Tall, Green
|
|
3
|
T_, gg
|
Tall, yellow
|
|
3
|
tt, G_
|
Dwarf, Green
|
|
1
|
tt, gg
|
Dwarf, Yellow
|
Backcross
Backcrossing is a crossing of a hybrid
with one of its parents or an individual genetically similar to its parent, in
order to achieve offspring with a genetic identity which is closer to that of
the parent.
The
Testcross
Because
some alleles are dominant over others, the phenotype of an organism does not
always reflect its genotype. A recessive phenotype (yellow) is only expressed
with the organism is homozygous recessive (gg). A pea plant with green pods may
be either homozygous dominant (GG) or heterozygous (Gg). To determine whether
an organism with a dominant phenotype (e.g. green pod color) is
homozygous dominant or heterozygous, you use a testcross.
The breeding of an organism of unknown
genotype with a homozygous recessive. If all the progeny of the testcross have
green pods, then the green pod parent was probably homozygous dominant since a GG x gg cross produces Gg
progeny. If the progeny of the testcross contains both green and yellow
phenotypes, then the green pod parent was heterozygous since a Gg x gg cross
produces Gg and gg progeny in a 1:1 ratio. The testcross was devised by Mendel
and is still an important tool in genetic studies.
Conclusion
- Genes are distinct entities that remain
unchanged during crosses
- Each plant has two alleles of a gene
- Alleles segregated into gametes in equal
proportions, each gamete got only one allele
- During gamete fusion, the number of
alleles was restored to two
Reference
- https://www.sscollegejehanabad.org/studymaterial/1970411271Mendelian%20Laws%20of%20Inheritance.pdf
- https://www.researchgate.net/publication/323914787_Mendel's_Laws
- http://www.nature.com/scitable/topicpage/gregor-mendel-and-the-principles-of-inheritance-593
- https://www.britannica.com/science/Mendelian-inheritance
- https://www.dnaftb.org/1/bio.html
Mendelian Inheritance – Hard MCQ Quiz
🧬 Mendelian Laws – Hard MCQ Quiz


.png)
.png)